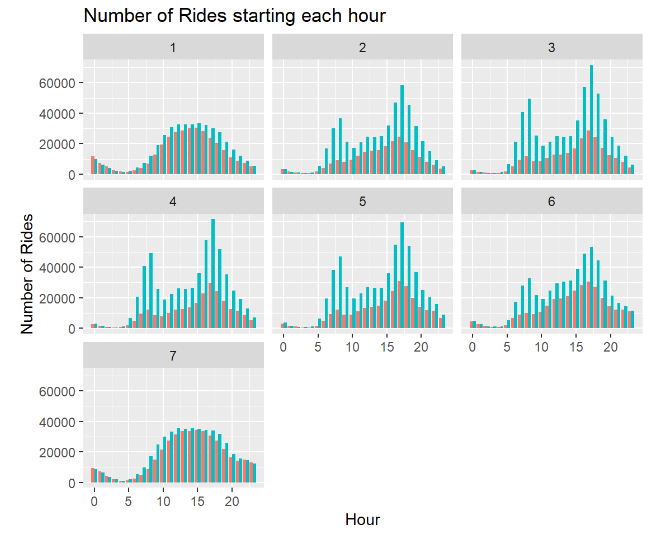
The Google Data Analytics Certificate wraps up with an optional Capstone Project. They provide a couple of case studies as options, and I chose the one about a bike-share company. The goal of this case study is to answer the question "How do annual members and casual riders use Cyclistic bikes differently?" with the intention to pass this information on to a team who will try to market the annual subscription to casual riders.
I created an R Markdown file to record my analysis, which could be shared with my team for review of my methods as well as to share my findings. This entailed reviewing the R code I learned in the course, deconstructing some of the provided helpful code, and learning new things on my own. It documents some of the learning so it's a bit messy and unrefined.
I also created a presentation in Slides to share my findings with the executive team. They care less about the detailed steps like importing and cleaning the data, instead focusing on results and supporting evidence. The presentation is bare bones in terms of animation and other polish, instead focusing on flow and efficiency in conveying findings. The speaker notes are an important piece of understanding its plan.

